Websites, where I sell my designs, run site-wide sales every few weeks. Everything is discounted, sometimes as much as 50%.
I know some artists complain about it. When there’s no sale we earn around 25% of the price of an item. When there is a sale we get less, often as low as 10%.
But sales bring in more customers, so more items are sold. In fact, we all earn more money during sales, even though we get paid less per item.
Unfortunately, none of the apparel websites show sales graphs so we can’t see clearly that sales are worth it. It would be great if they implemented it. But for now, I can show you a sales graph for games sold on Steam.
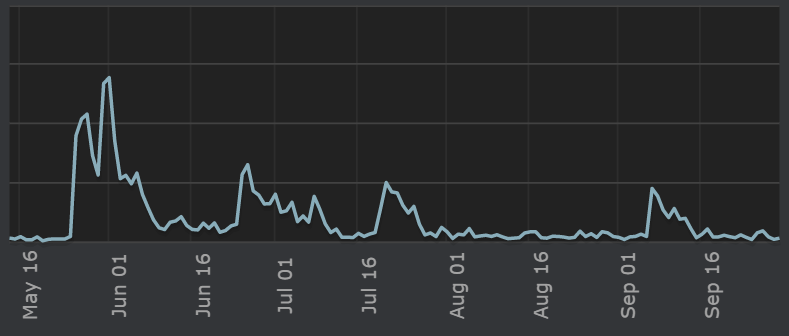
This is a graph showing units sold of all our games:

Each spike is during a sale. The first spike is the Summer Sale – it’s one of two big events during the year. The smaller spikes are during less significant events, like Weekly Deal. But even the smaller sales bring in a 5x increase in the volume of sold games.
A graph for apparel sales would look similar. I will see if I can export the data and create my own graphs. Stay tuned.